
Case study: LiDAR inventory of a Christmas tree plantation
How many trees will be ready for sale next year?
For a Christmas tree grower, that question comes back every season. Answering it often means walking the rows, counting, measuring a few trees and extrapolating. Over tens of hectares, it is slow, remains approximate, and quickly goes out of date.
We wanted to show that a single drone survey can replace that work with a complete, tree-by-tree inventory.
The mandate
- Site
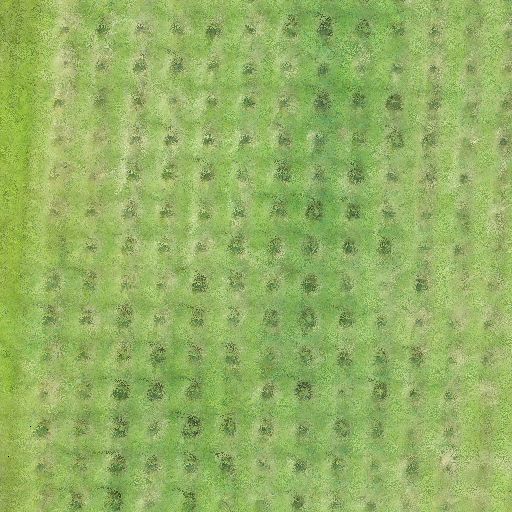
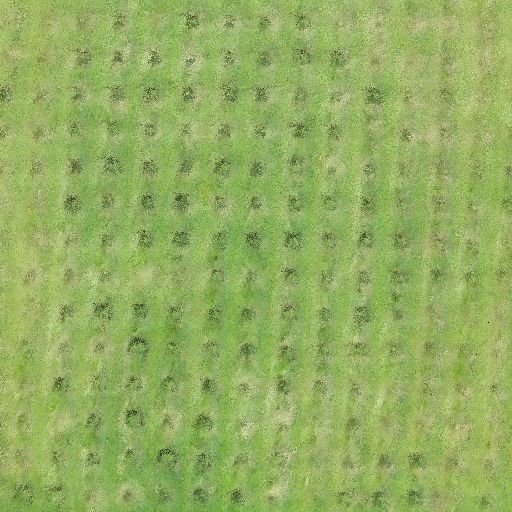
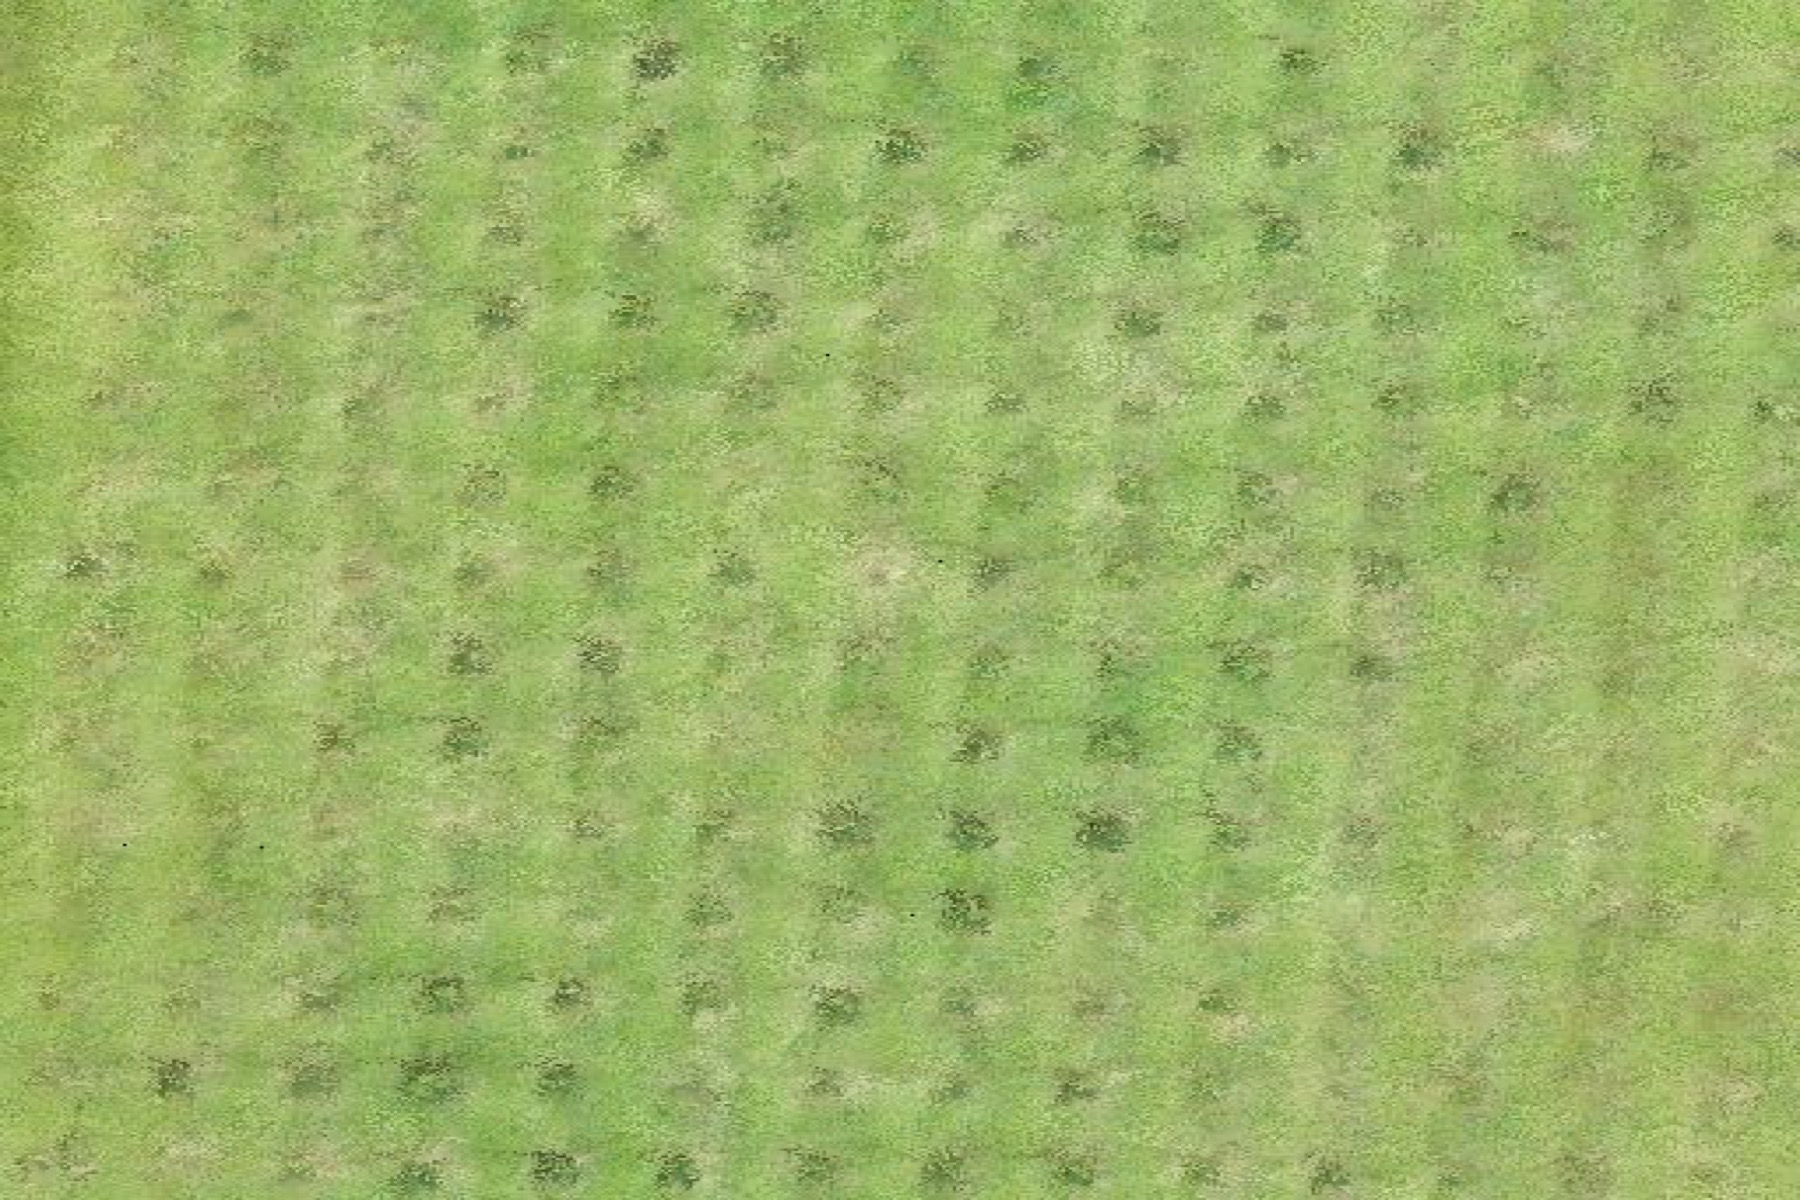
- a Christmas tree plantation in Quebec’s Eastern Townships, about 41 hectares, with blocks of mixed ages — from young seedlings to trees ready to cut.
- Objective
- count every tree, measure its height and produce a clear portrait of the plantation by height class.
- Constraint
- the blocks are bordered by woodlots, hedges and scrub that must be distinguished automatically from planted firs.
Our approach
- 1
Aerial survey
We flew 6 automated missions with a DJI Zenmuse L1 LiDAR sensor. LiDAR measures terrain with laser pulses. It captures both ground and vegetation, and the built-in camera colourizes each point. In total, more than 1.2 billion points were collected.
- 2
Fusion and quality control
The 6 point clouds were merged and aligned. We checked vertical agreement on reference surfaces such as roads, to within a few centimetres.
- 3
Terrain and height model
True ground is extracted under the vegetation. Each tree’s height is then measured above the ground — not above an approximate relief.
- 4
Automatic detection
Each fir is located as a local peak in the height model. A regularity filter keeps only trees aligned in plantation rows. Scrub, shrubs and spontaneous vegetation are rejected automatically, without drawing zones by hand.
- 5
Indicators
For each tree we compute position, height and, for established specimens, crown width. Crown colour is also compared with surrounding grass, to flag trees that deserve a field visit (pale top: yellowing, dead tree or weed pressure).
Results
| Indicator | Result |
|---|---|
| Trees detected | 38,959 |
| Area covered | 41 ha |
| Average density | ≈ 950 trees/ha |
| Trees taller than 1.5 m | 5,277 |
| Trees flagged “to check” | 598 |
Breakdown by height
- under 0.5 m26,474 trees
- 0.5 to 1 m4,442
- 1 to 1.5 m2,766
- 1.5 to 2 m2,278
- over 2 m2,999
At a glance, the grower sees that the plantation is mostly young. They know how many trees will reach sale size in the coming seasons — and where they are.
What the grower receives
- An inventory by block: tree counts by height class, to plan harvest and sales.
- A GIS file with one point per tree: usable in QGIS, Google Earth or on a phone in the field.
- Terrain and height models at 20 cm: useful for spotting wet areas, drainage issues and uneven growth.
- A list of trees to check first.
- An interactive map to view and share easily.
Interactive map
Photo / relief basemaps, stands, heights and filters — explore the Christmas-tree inventory as in the field.
What’s next? Year-over-year monitoring
The real value comes with a second survey. Comparing two seasons measures each tree’s actual growth, flags areas that plateau and tracks replants. The inventory then becomes a management tool.
Client
Grower — Eastern Townships
Sector
Forestry & agriculture
A similar project?
Let’s discuss your specific needs and how we can support you.
Your plantation, tree by tree
Do you grow Christmas trees, or manage a nursery or orchard? We can build the same portrait of your operation.
Project visuals